Monthly Markets Memo - June 2025
Markets entered summer on a high note in May, buoyed by a temporary pause in the US-China trade dispute, stronger-than-expected economic data, and a Federal Reserve content to wait for clearer signals. After a turbulent April, investor sentiment improved sharply, helping equities recover lost ground and close the month with broad-based gains.
Pool’s Open!
Per the Gregorian calendar, Summer begins on June 21st (aka the Summer Solstice). Culturally, many Americans treat Memorial Day weekend as the “unofficial” start to the season. This year, investors kicked-off summer on May 12th when trade representatives for the US and China announced a negotiated 90-day pause/rollback of the retaliatory and escalated tariffs that had resulted in mutual-tariffs of 125% on goods imported from each country. US Equities jumped 3.5% on the day of the announcement, breaking back into positive territory for 2025, after being down as much as -15% in the days following the “Liberation Day” tariffs rollout.
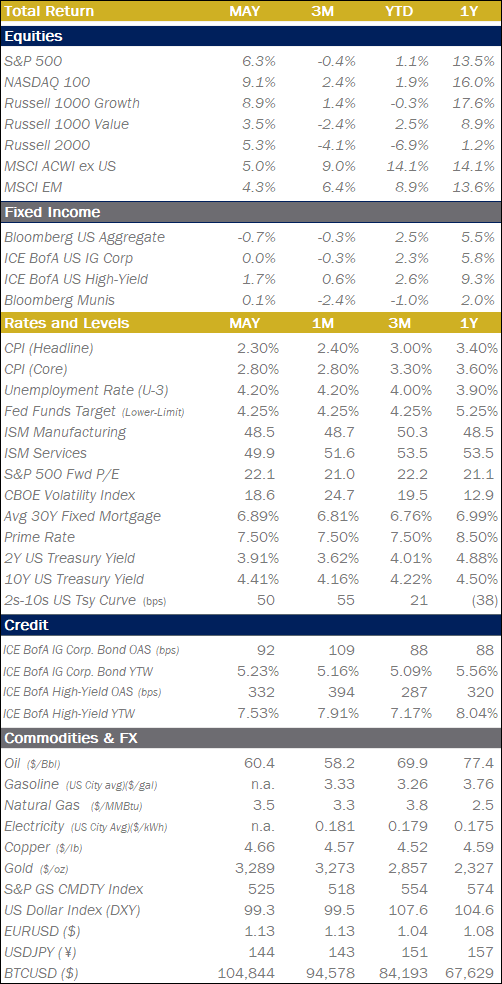
Following an opening week of economic data that ranged from benign to positive (jobs and CPI both better than expected) and an FOMC that was more than happy to wait for more definitive data to guide its decision-making, the news of a temporary truce in the trade war had the market vibes feeling immaculate, especially relative to the experience of the prior month. All equity asset classes ended the month higher: S&P 500 +6.3%, Nasdaq100 +9.1%, Large-Cap Growth Stocks +8.9%, Large-Cap Value Stocks +3.5%, Small-Cap Stocks +5.3%, Global Ex-US Stocks +5.0%. Most notably, the S&P 500 reclaimed a positive YTD (+0.9%) return by the end of May.
.png?lang=en-US "07-2024-Returns.png")
Quick Hits
Mood Swing at Moody’s
Moody’s downgraded the US Government’s long-term credit rating from AAA to AA1. They took this action nearly 14 years after S&P first downgraded the US from AAA to AA+ in the midst of the Eurozone debt crisis, following a high-stakes debt-limit game of chicken, and nearly 2years after Fitch downgraded the US following a particularly harrowing debt-limit showdown in 2023. What was the catalyst this time for the remaining major credit rating agency to downgrade the US? While there wasn’t an acute moment such as a particularly traumatizing game of debt-limit chicken, one supposes that after years of tough fiscal talk from the Republican party, Fitch was expecting some legislative progress towards reducing the deficit since the party is currently in control of all aspects of US government power. Following the advancement of the One Big Beautiful Bill Act out of the House Finance Committee, and its apparent lack of deficit reduction, Fitch announced its downgrade of the US Credit rating, and it is no longer the outlier among its major ratings agency competitors. The markets essentially shrugged at the announcement as this was, sadly, nothing new since 2011. One day the markets may care about fiscal governance and sustainability, but it doesn’t seem to right now.
You Down with OBBB? (Yeah You Know Me)
Speaking of the One Big Beautiful Bill, as it stands right now, the Senate seems unlikely to send their version of the bill back to conference before the President’s July 4 deadline. The bill currently includes an unexpected level of spending increases in the next two years that are offset with significant spending cuts in later years. This results in modest economic tailwinds upfront, flipping to headwinds in years 3-5. Simply, it seems to have a classic sugar-rush/sugar-crash dynamic built in to enable it to pass via the Senate reconciliation process (i.e., no new absolute dollars spent).
Number of the Month

69% of all Public US Government Debt (Total US Debt excluding intra-US Government debt, such as liabilities to the Social Security Trust Fund) is held by domestic investors and the Federal Reserve, 31% is held by foreign investors. When the long-term fiscal situation for the US government arises as a point of concern and discussion amongst market participants, the role of foreign holders of the debt inevitably arises. Often, the concern is framed as “if we don’t do X, then other countries will stop buying our debt.” Well, looking back at 35yrs of holdings data, we can see that while other countries have continued to purchase our debt, the foreign investor proportion has shrunk from a high-water mark of 49% in Q2 2008, down to 31% in Q1 of this year. While the relative fiscal sustainability may play a significant role in future investment decision-making of investors, looking back at the market dynamics of the past we can see that the likely explanation for this decline in the ratio of foreign investors in US Debt can be explained by 1) Federal Reserve’s introduction of its expanded balance sheet tools during the Global Financial Crisis and in subsequent market crises since 2) changes in bank capital regulation driving greater demand for US treasuries by US financial institutions, and 3) the emergence of potential alternatives (e.g., China, repaired Eurozone balanced sheets, etc) to the USD as the primary reserve currency and US Treasury debt as the primary risk-free asset.

On Deck this Month
- 06/02 – ISM Manufacturing (May), Sine Die for the 89th Regular Session of the Texas Legislature
- 06/03 – JOLTS (April)
- 06/04 – ISM Services (May)
- 06/06 – Employment Report (May)
- 06/10 – NFIB Survey (May)
- 06/11 – CPI (May)
- 06/12 – PPI (May), 30yr Treasury Bond Auction
- 06/13 – Consumer Price Index (May), NFIB Survey (May)
- 06/17 – Import Prices (May), Retail Sales (May)
- 06/18 – FOMC Rate Decision, FOMC Economic Projection, Fed Chair Press Conf.
- 06/19 – Juneteenth National Holiday (Bank and Market Holiday)
- 06/24 – UofM Consumer Confidence (Jun)
- 06/26 – Real GDP (Q1 3rd/Final Estimate), Durable Goods (May)
- 06/27 – Personal Incomes (May), PCE (May)
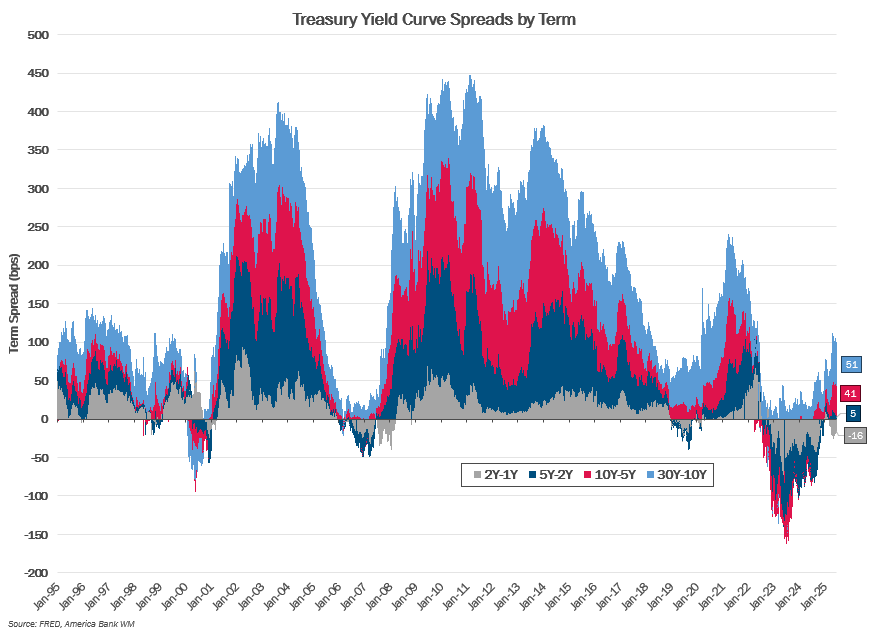
Chart of the Month: Coming to Terms with Higher Term Premiums
Since mid-April, when quickly rising long-term treasury yields caught the attention of the White House and the Treasury Secretary, markets have kept an eye on the long-end of the curve trying to tie price action to a narrative around degrading fiscal sustainability of the US Government. Detailed in the chart below is a daily trend of the spreads between certain key points on the Treasury Yield Curve. Relative to recent years, the term premium for the 30Y relative to the 10Y has certainly increased, but relative to thirty years of history going back to 1995, we’re likely just seeing a normalization of term premium in the treasury curve. As the chart shows, in periods of time that have an upward sloping yield curve, there is a healthy amount of stratification between the key tenors of the yield curve, where investors demand compensation for the increased interest rate risk they take on as they go further out in maturity.
.png?lang=en-US "MMM-Graph-2-Credit-Spreads.png")
Equities
.png")
.png?lang=en-US "MMM-Graph-3-Equities-2.png")

Fixed Income
.png?lang=en-US "MMM-Graph-4-US-Treasury.png")

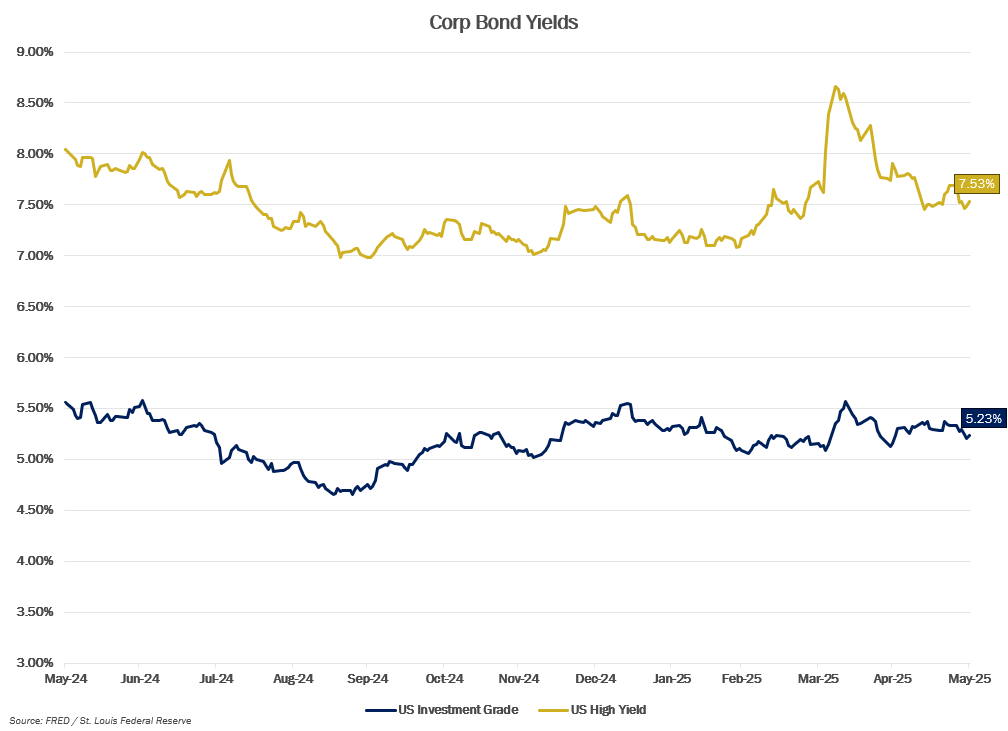.png?lang=en-US "MMM-Graph-5-Crop-Bond.png")
Economic Data
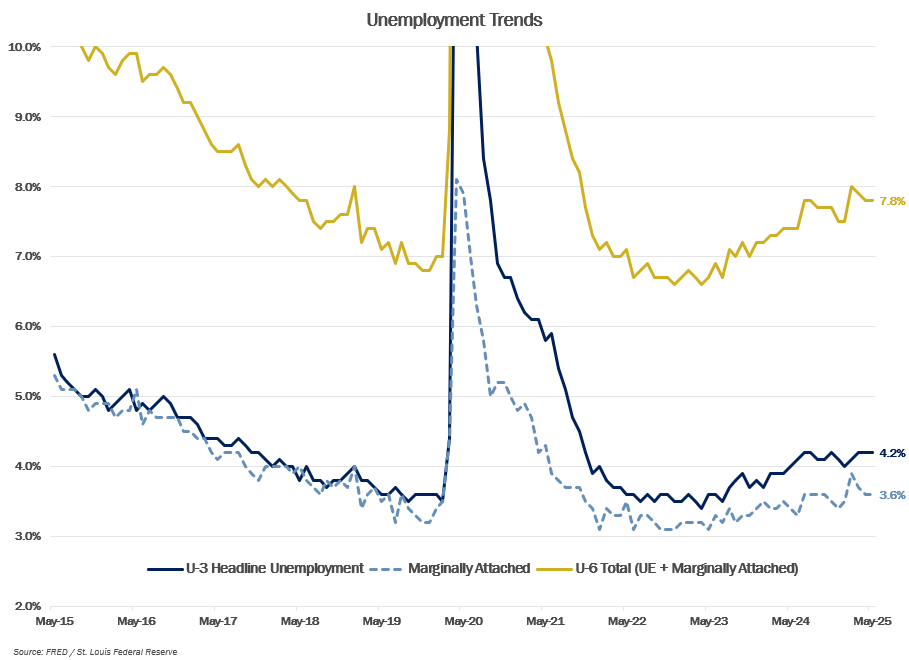.png?lang=en-US "MMM-Graph-6-Unemployment-Trends.png")
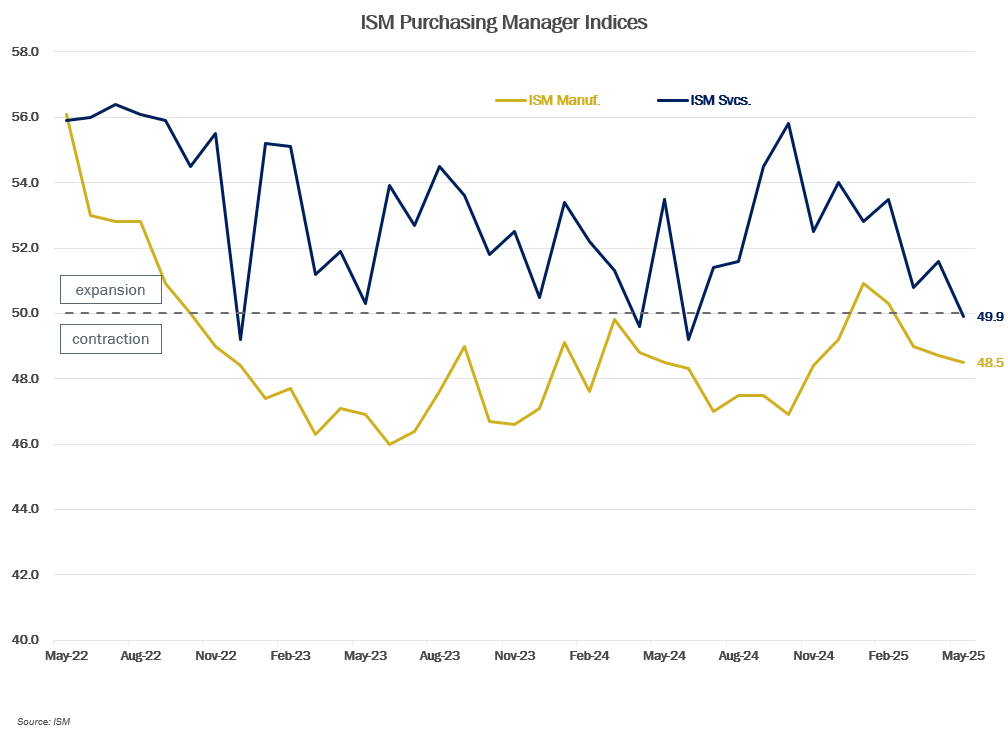.png?lang=en-US "MMM-Graph-7-ISM.png")
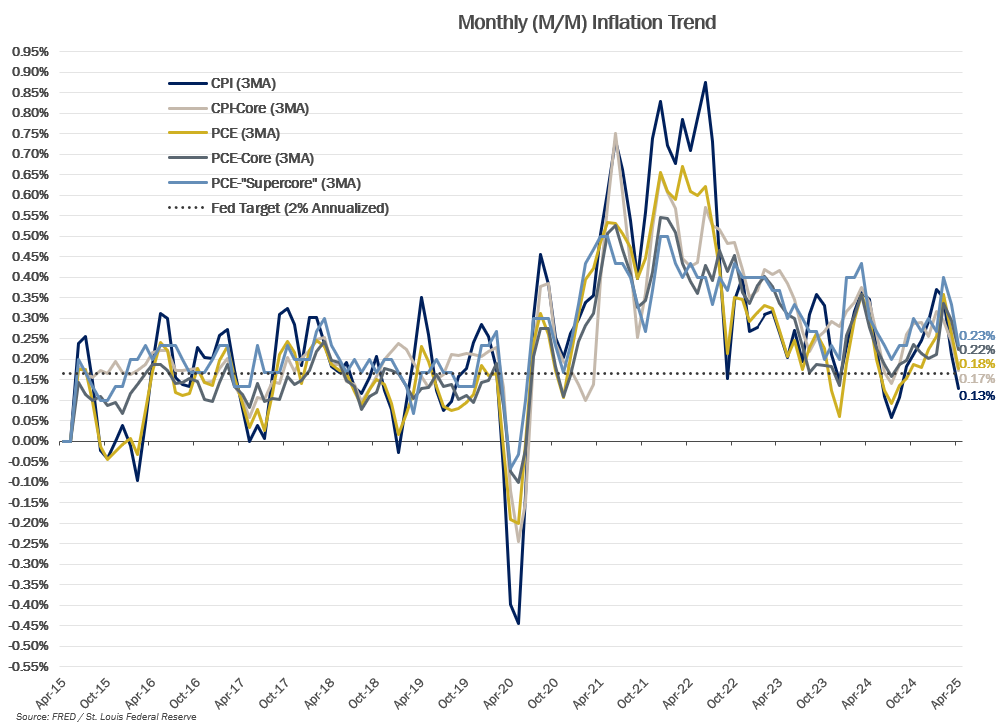.png?lang=en-US "ECON-Inflation-Trend-(1).png")
Serving Generations of Texas Families
We attain an in-depth understanding of our clients’ immediate and long-term goals, collaborating with their advisors to create a comprehensive financial plan, unique to them and their family.
INVESTMENT AND WEALTH SERVICES: Not a deposit | Not FDIC insured | No Bank guarantee | May lose value