Monthly Markets Memo - May 2025
April saw the much-expected rollout of President Trump’s new tariffs on imported goods. Despite the high-level of anticipation, the scope, magnitude and stated goals of the new tariffs sent shockwaves through global markets.
April Tumult: Tariffs, Trade, and Treasuries
April saw the much-expected rollout of President Trump’s new tariffs on imported goods. Despite the high-level of anticipation, the scope, magnitude and stated goals of the new tariffs sent shockwaves through global markets. For nearly a week (4.5 trading days), the Administration held firm in its public statements that the goal of the tariffs was to re-architect the global trade system, driving manufacturing back to the US and balancing trade between the US and the rest of the world. In the two days equities sold off hard, and Treasuries rallied (yields dropped) but then yields started rising as the persistent message of re-engineering global trade really began to take hold and, it is posited, foreign investors began to trim their holdings of US long-term bonds in anticipation of having fewer US dollars to hedge. This led to the largest 5-day rise in the 10Y US Treasury yield since June of 2022 (peak inflation and FOMC pounding the table on rising rates). This fast and unexpected move in the 10Y further spooked markets and, ultimately, caused the administration to blink. On April 9th, President Trump posted on social media that he would be suspending the announced “reciprocal” tariffs for most countries (China was excluded, because it had retaliated with new tariffs of its own). Further, over the following days, the administrative face of the tariffs changed from the WH council of economic advisers and Commerce Sec. Lutnick to Treasury Sec. Bessent. Further, the newly communicated rationale for the tariffs and 90-day pause was to allow for time to negotiate bilateral agreements with countries in an effort to isolate/pressure China. These were viewed by investors as very market-friendly/responsive changes by the administration and by the end of the month, equities had erased most of their losses since “Liberation Day”. While the pause of the announced tariffs and the public pivot away from re-orienting the global trade system was certainly welcomed by markets, the cloud that continues to hang over markets and bears keeping in mind is the temporary nature of all trade policy under the administration. It’s unclear what the endgame is for the administration on trade: do they genuinely want to increase manufacturing in the US? Are they seeking to induce modest concessions from Allies and close trade partners? Or is the endgame to raise tax-revenue to allow for more flexibility in their proposed tax legislation? No one can say with any certainty what the goal is, and that is likely by design from the administration to try to maximize their negotiating leverage. With this lack of clarity around the endgame, and the trade policy via executive order nature of the agreements, a volatility premium will likely persist in markets and bears watching closely.
.png?lang=en-US "07-2024-Returns.png")
On Deck this Month
- 05/01 – ISM Manufacturing (Apr)
- 05/02 – April Employment Report
- 05/05 – ISM Services (Apr)
- 05/07 – FOMC Rate Decision and Fed Chair Press Conf.
- 05/12 – Last day for TX House committees to advance bills or resolutions
- 05/13– Consumer Price Index (Apr), NFIB Survey (Apr)
- 05/16 – Import Prices (Apr)
- 05/22 – Retail Sales (Apr), Producer Price Index (Apr)
- 05/25 – Last day for TX House committees to advance Senate Bills or Resolutions
- 05/26 – Memorial Day (Markets Closed)
- 05/28 – NVDA Earnings Release (Fiscal Q1 Feb-Apr 2025)
- 05/29 – Q1 Real GDP (2nd Estimate)
- 05/30 – Personal Consumption Expenditures (April)
Quick Hits
The Walking Fed
March CPI on a month-over-month basis was negative for the first time since May of 2020. To be fair, this was primarily driven by a cratering of energy prices due to global growth fears from a pending trade war. That said, even the core CPI (ex-food & energy) data was far softer than expected, coming in at 0.1% m/m (1.21% annual compounded rate, well below Fed target). Monthly inflation of 0.2% is right about where the Fed wants inflation to be. In an alternate universe that doesn’t have the inflationary fears of Tariffs and trade disruptions, the FOMC would likely be declaring victory over inflation and positioning monetary policy to a more neutral policy rate. We live in the known universe though, where tariffs and trade disruption are part of the current economic calculus, and the Fed will remain on hold for the foreseeable future, reticent to adjust policy to be more neutral or even accommodating of growth, for fear of inflation rising from the seemingly dead in the wake of new tariffs and new supply chain disruptions.
Stay Golden
On April 22, the spot price of Gold hit an all-time intra-day high of $3,500/oz. Gold has been one of the few bright spots in assets as concerns about the existing global trade system have roiled markets. One of the pillars supporting the price of gold has been a weakening of conviction in the US Dollar & US Treasury Bond as the world’s risk-free asset. With no obvious currency and sovereign bond alternatives, Gold remains the asset of choice for investors seeking a form of non-USD safety.
“You’re [Not] Fired!”
In the past several months, in public statements or social media posts the President has alluded to or stated an outright desire to terminate Federal Reserve Chair Jay Powell prior to the expiration of his term in 2026. This rhetoric and saber rattling had the effect of spooking markets, and in the post April 9th public pivot from the Administration to more “markets-aware” rhetoric, the President has since reversed course and stated that he has no intention of firing the Fed Chair, instead waiting out the end of his existing term. Investors are interpreting this as another sign of the administration’s markets awareness and/or responsiveness, which is believed to bode well for the future policymaking process and their respective rollouts.
Number of the Month

The estimated effective rate for 2025 Tariffs (includes the existing 90D pause on “reciprocal,” non-industry specific tariffs) is a whopping 23%. This is largely due to the massive punitive tariffs of 145% currently in place with China, which accounts for a significant portion of US trade. Plotted on the chart below is the annual effective US tariff rate (Customs duties collected divided by Imports) since 1947. Plotted alongside it is the % contribution to Real GDP by Imported Goods. The post-WWII high for US Tariffs was 7.7% in 1965, and at that time imported goods accounted for less than 5% of US Real GDP. At the currently proposed and effective levels, 2025 would see a 23% effective tariffs rate with imported goods accounting for nearly 11% of US Real GDP. In the first Trump administration (Trump 1.0) when the President introduced tariffs on China, they were targeted and resulted in a 2.5x increase of tariffs on goods imported to the US (peaking at 2.9%). While the negotiation and imposition of tariffs at the time drove market volatility (remember December 2018?), it was during a time of frustratingly low inflation, and it was fairly easily absorbed into the economy. This time around (Trump 2.0) policy that is currently proposed and in-effect will amount to a 9.5x increase in the tariffs collected on imported good to the US, occurring at a time when inflation remains stubbornly high and consumer ability to absorb further price increases appears strained. While policymakers seem to be willing to step back from the brink of the most extreme policies, which has assuaged markets, investors should remain clear-eyed about the very real economic effects. If what is ultimately imposed is reduced to as little as 1/3 of what is currently in effect, that’s still at post-WWII highs seen in the mid-1960s, but with our GDP twice as reliant on imported goods as it was back then.
.png")
Chart of the Month: Soft Surveys, Hard (to Find) Data
So called “soft” data, where data providers survey consumers about their feelings on the economy or business executives on their current activities, prices paid, hiring, etc. as well as their outlooks for future activities, prices paid, hiring, etc. have essentially fallen off a cliff in response to the tariff announcements from the administration. The sharpness of decline in these data sets is similar to declines seen in previous recessionary environments. The so-called “hard” data, observable data out in the economy or actual “transactions” so to speak, such as the monthly Employment Report (Nonfarm Payrolls + Unemployment rate), Weekly Unemployment Insurance Claims, and CPI/PCE. The hard data has not yet “confirmed” the decline in the “soft” data. This gap can’t persist for too long, either the vibes will improve or we’ll begin to see cracks in the observable economic data (e.g. layoffs increasing, consumers spending less, etc.)

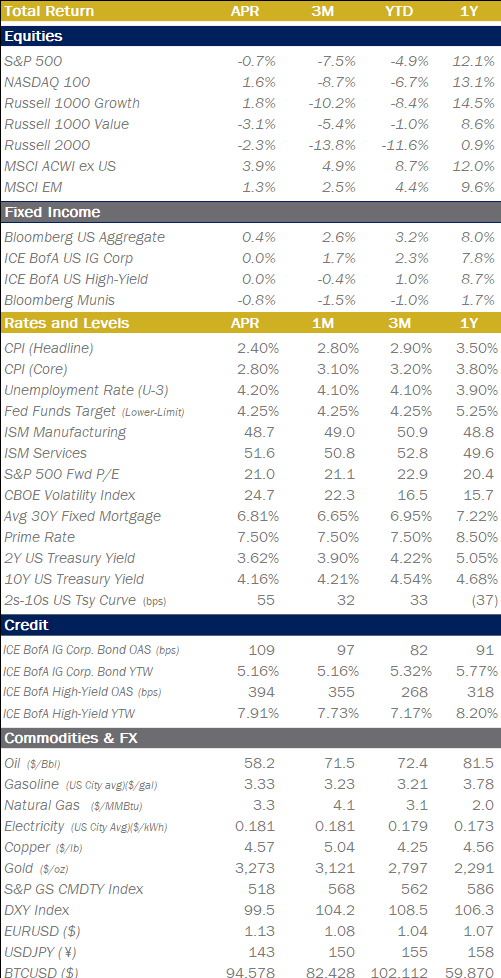
Equities
.png")


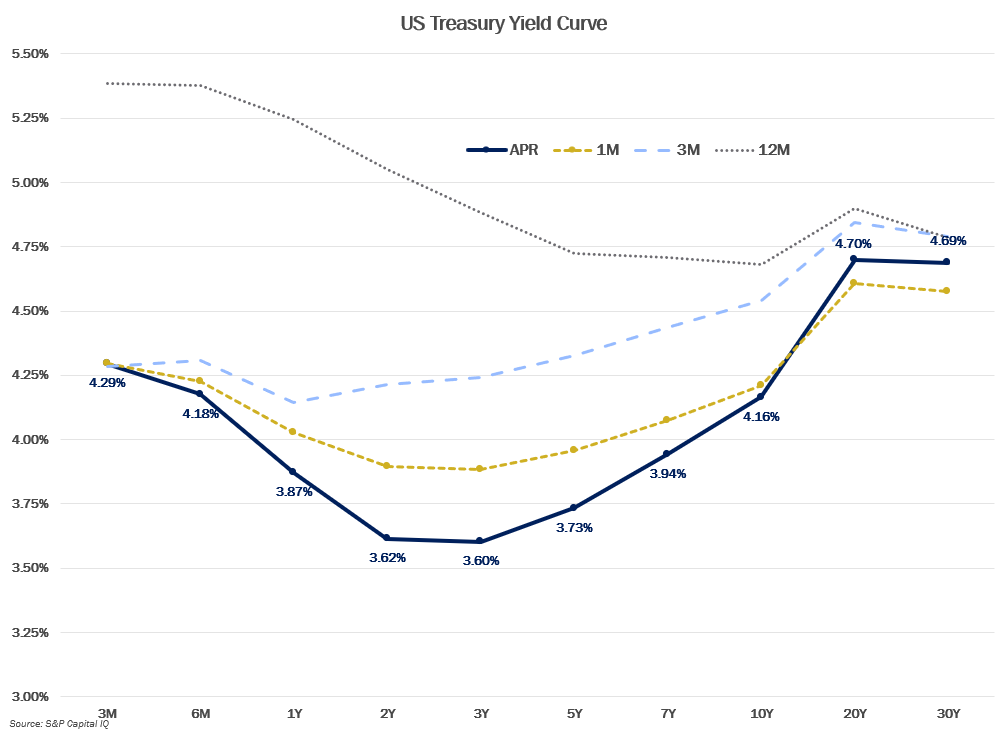
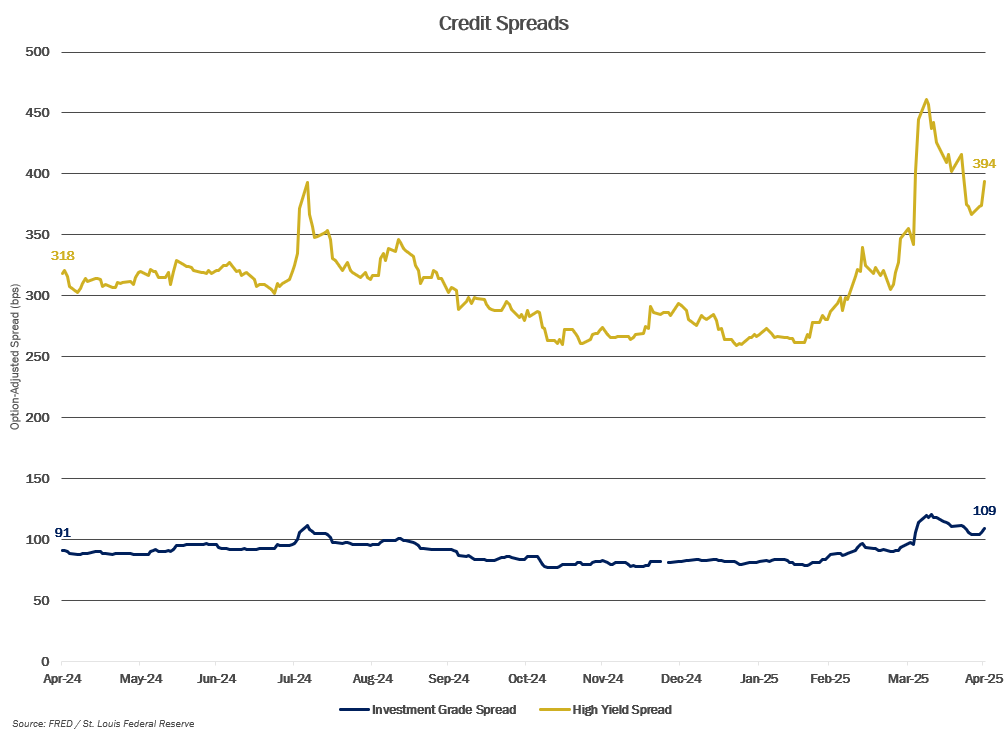
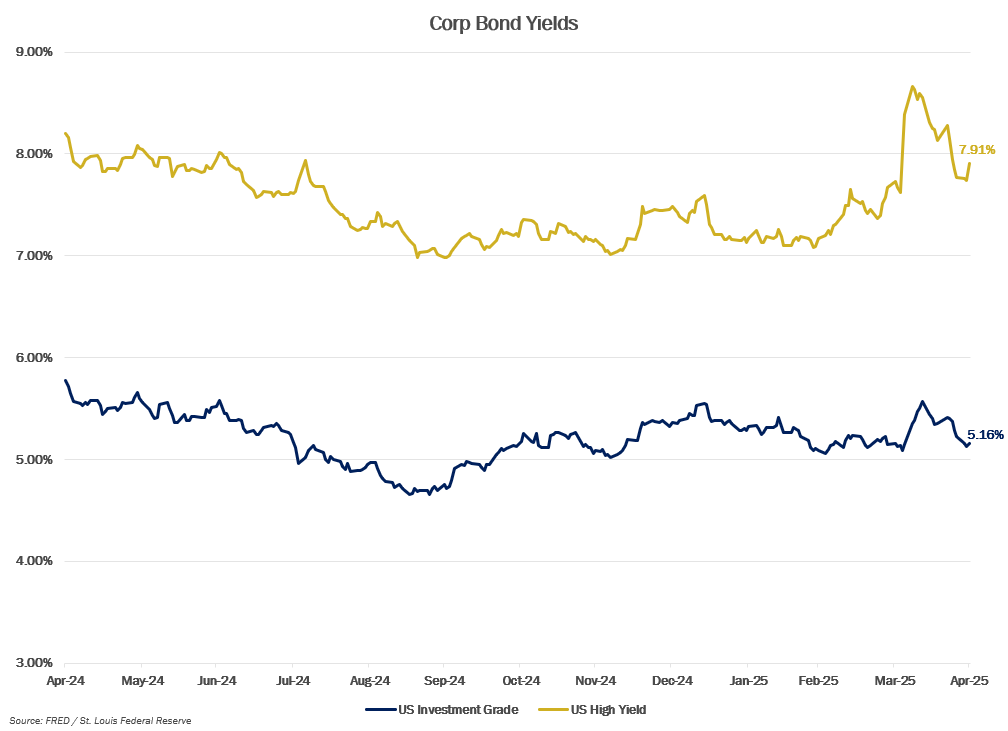
Fixed Income
.png?lang=en-US "MMM-Graph-4-US-Treasury.png")
.png?lang=en-US "MMM-Graph-2-Credit-Spreads.png")
.png?lang=en-US "MMM-Graph-5-Crop-Bond.png")
Economic Data
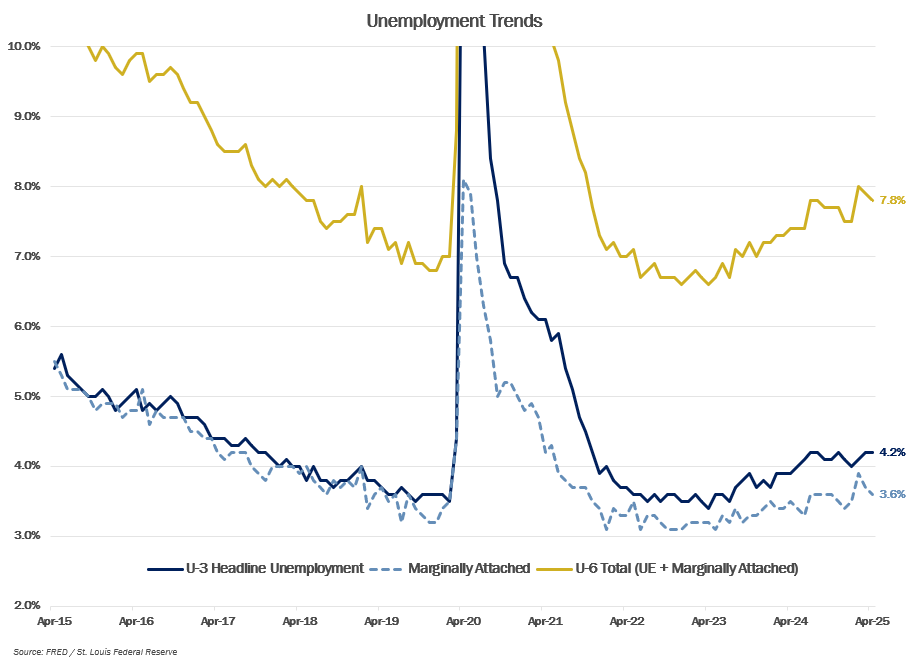.png?lang=en-US "MMM-Graph-6-Unemployment-Trends.png")

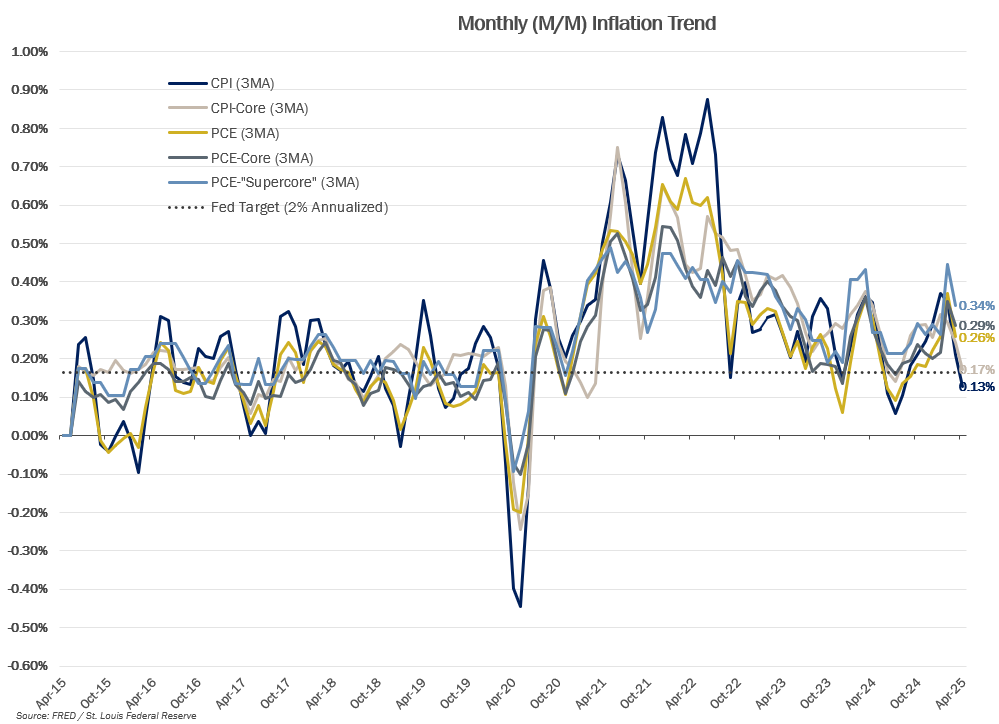.png?lang=en-US "ECON-Inflation-Trend-(1).png")
Serving Generations of Texas Families
We attain an in-depth understanding of our clients’ immediate and long-term goals, collaborating with their advisors to create a comprehensive financial plan, unique to them and their family.
INVESTMENT AND WEALTH SERVICES: Not a deposit | Not FDIC insured | No Bank guarantee | May lose value